PD-1 / PD-L1 Checkpoint Pathway Diagram
The checkpoint blockade story in one panel: PD-L1 on a tumor cell binding PD-1 on a T cell, the inhibitory signal, and antibody blockade restoring cytotoxic activity.
업데이트 2026-09-24
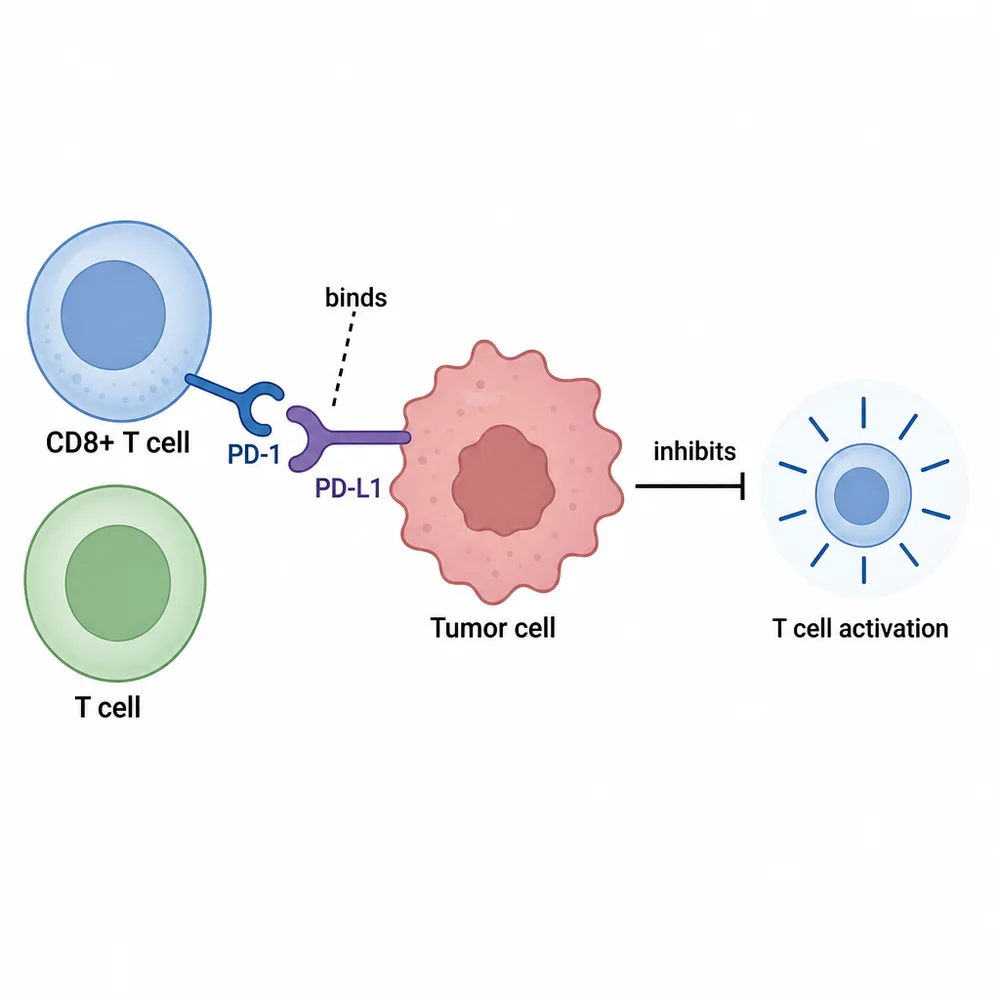
A PD-1/PD-L1 checkpoint pathway diagram: PD-L1 on a tumor cell binds PD-1 on a CD8+ T cell and delivers an inhibitory signal; an anti-PD-1 antibody blocks the interaction and restores T cell killing of the tumor cell. Label the receptors, the antibody, and show inhibition vs restored activity.
이 템플릿이란?
Checkpoint pathway diagrams show receptor–ligand binding, the downstream inhibitory signal, and how a therapeutic antibody interrupts it. They anchor introductions for immuno-oncology papers and drug-mechanism slides.
적용 장면
- Introduction figures for checkpoint-blockade studies
- Drug mechanism-of-action slides
- Immunology teaching materials
- Review article summary figures
나만의 그림으로 바꾸는 방법
Open the template in the studio
The checkpoint pair and blockade are pre-described; generate, then verify receptor labels.
Retarget the axis
Ask to "show CTLA-4/B7 instead" or "add TIM-3" to reuse the layout for a different checkpoint.
Split before and after
Ask for two panels — "with blockade" and "without blockade" — if reviewers expect the comparison explicitly.
자주 묻는 질문
Can I add downstream signaling?
Yes — ask for specific nodes (e.g. "show SHP-2 recruitment downstream of PD-1"). Keep the panel readable: two to three signaling nodes is usually enough.