PD-1 / PD-L1 Checkpoint Pathway Diagram
The checkpoint blockade story in one panel: PD-L1 on a tumor cell binding PD-1 on a T cell, the inhibitory signal, and antibody blockade restoring cytotoxic activity.
Aggiornato il 2026-09-24
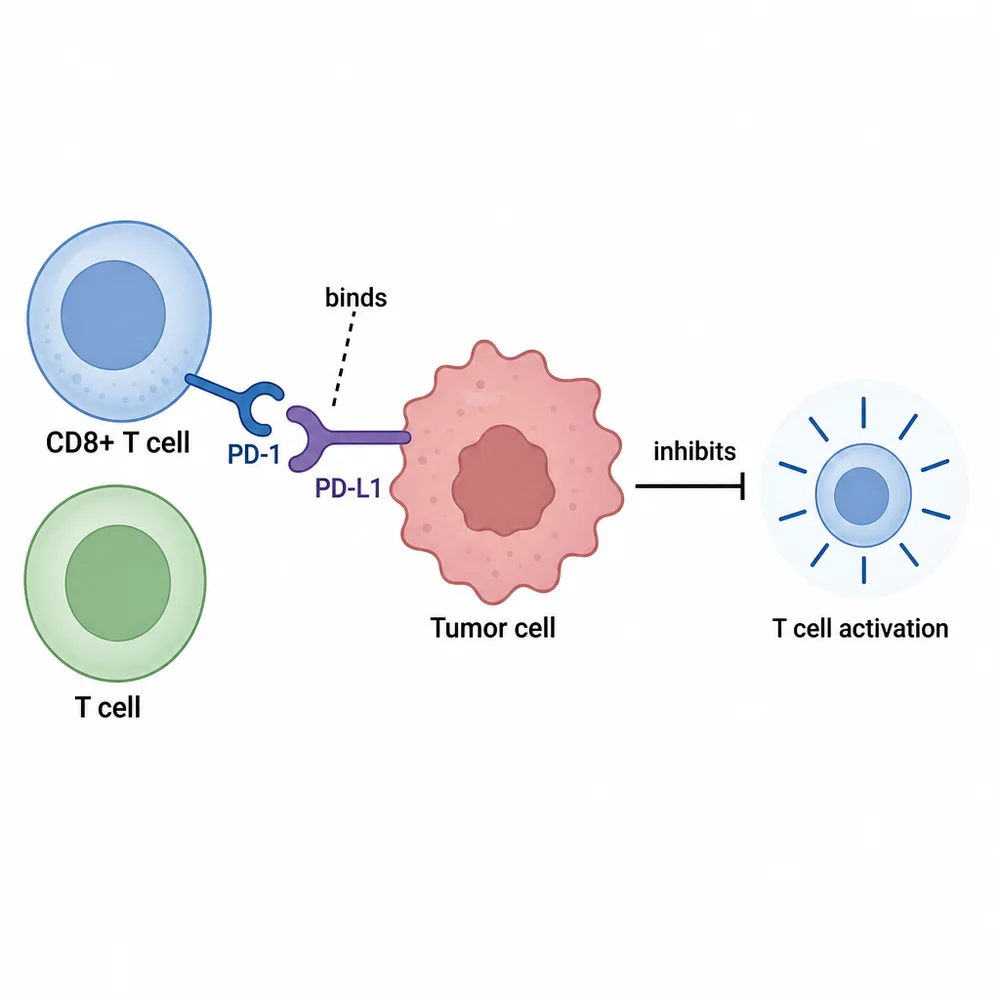
A PD-1/PD-L1 checkpoint pathway diagram: PD-L1 on a tumor cell binds PD-1 on a CD8+ T cell and delivers an inhibitory signal; an anti-PD-1 antibody blocks the interaction and restores T cell killing of the tumor cell. Label the receptors, the antibody, and show inhibition vs restored activity.
Cos’è questo modello?
Checkpoint pathway diagrams show receptor–ligand binding, the downstream inhibitory signal, and how a therapeutic antibody interrupts it. They anchor introductions for immuno-oncology papers and drug-mechanism slides.
Dove si adatta
- Introduction figures for checkpoint-blockade studies
- Drug mechanism-of-action slides
- Immunology teaching materials
- Review article summary figures
Come renderlo tuo
Open the template in the studio
The checkpoint pair and blockade are pre-described; generate, then verify receptor labels.
Retarget the axis
Ask to "show CTLA-4/B7 instead" or "add TIM-3" to reuse the layout for a different checkpoint.
Split before and after
Ask for two panels — "with blockade" and "without blockade" — if reviewers expect the comparison explicitly.
Domande frequenti
Can I add downstream signaling?
Yes — ask for specific nodes (e.g. "show SHP-2 recruitment downstream of PD-1"). Keep the panel readable: two to three signaling nodes is usually enough.